Posts
-
Plotting JSON Data with Chart.js

Chart.js is a open-source, light-weight (~11KB) library based on the HTML5 canvas control. It supports a limited number of charts, but unlike Google Charts it can be embedded directly in your website and made available offline.
-
Plotting JSON Data with Google Charts

This example shows how to take raw JSON data and plot it using the Google Charts API. See Google’s chart gallery for examples of what you can plot based on your JSON data.
-
MQTT to JSON HTTP Logger
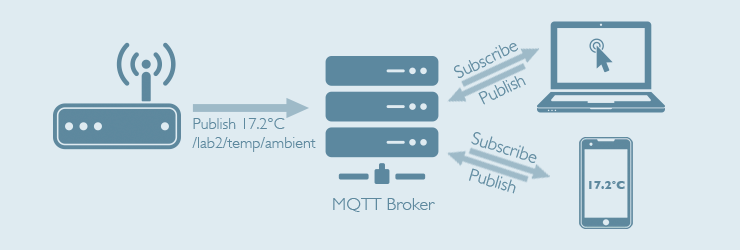
This guide will help you setup an MQTT broker and HTTP server that logs all published MQTT data to a local database, and exposes the data in JSON format over HTTP. An AWS EC2 instance running Ubuntu Server 14.04 will be used here, but a Raspberry Pi would also work fine.
subscribe via RSS